세계 대기질 지수 팀에 문의하기

The World Air Quality Index project is a non-profit project started in 2007. Its mission is to promote air pollution awareness for citizens and provide a unified and world-wide air quality information.

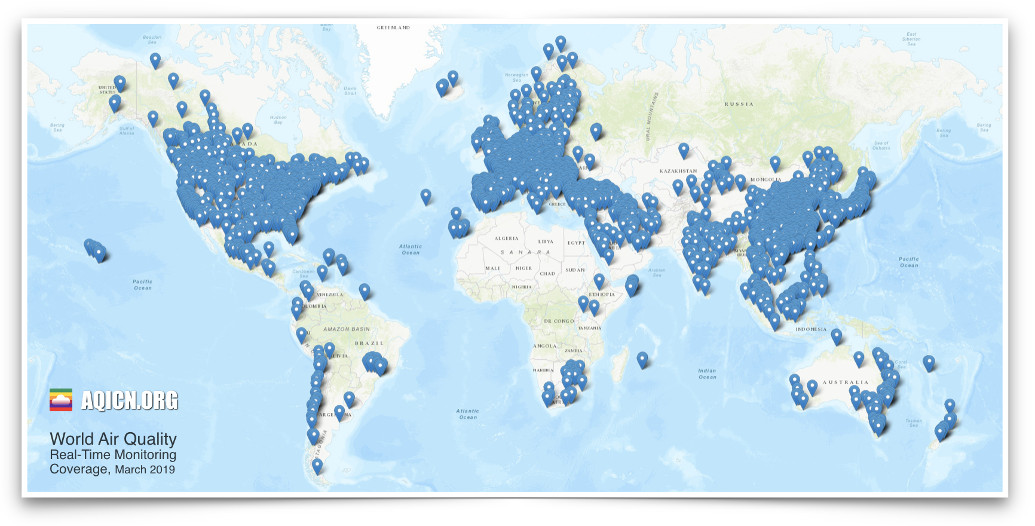
The project is providing transparent air quality information for more than 88 countries, covering more than 11,000 stations in 1000 major cities, via those two websites: aqicn.org and waqi.info.
The founding team, located in Beijing China, is composed of several contributors in the domain environmental sciences, system engineering, data science, as well as visual design. The team has been expanding worldwide, with new key supporters from Singapore, India, Australia, USA.

The project, despite its social intent and expensive outreach, has never received any public funding. The limited income, essentially from online ads, is used to cover the infrastructure and hardware cost. Engineering work is contributed.
The project is constantly looking for support from more contributors. It has now received active contributions from more than 12336 citizens from 123 countries:
Loading contact form...

Due to our small team limited capacity we can not guarantee replying to all messages. Instead, please use the following dedicated contact pages:
  • If you are from an EPA or want to submit/update an air quality data feed, check the data feed page.
  • If your country or city is not covered on the map, but you'd like to, check the new coverage page.
  • If you want to contribute and help promoting air quality awareness, check the contribute page.
  • If you want to setup your own air quality station, check the air quality sensor / monitoring page.
  • If you need access to the air quality data from our map, check the API and/or data platform pages.
You can also refer to the common list of questions and answers below.

You can also visit us on facebook.com or twitter.com

made in 北京

Share: aqicn.org/contact/kr/

Credits


대기질 측정 자료는 주중 미국 대사관과 세계 각지의 환경 보호 기관들의 대기오염을 개선하기 위한 노력의 일환으로 제공되었습니다.

All this work is made possible thanks to the excellent work for the worldwide EPA (below list not exhaustive):

--

We are looking for help to translate this website. More information, please check the translation page.

Common question & answers

  1. Air Quality Data sources: All the Air Quality data seen on World Air Quality Index are the official data from each country respective Environmental Protection Agency (EPA). Data from each EPAs is measured using professional monitoring equipment. The full EPA source list used in World Air Quality Index is available from sources page.
  2. Seeing different readings from other websites: This is most likely normal, and due to the fact that different websites use different AQI scales present the data. At World Air Quality Index, we are using the US EPA scale, while other website might use different scales. Check this article for more information.
  3. I want to monitor the air quality in my area: As high-end professional stations can be really expensive (more than $10K per stations), the World Air Quality Index project / Earth Sensing Labs has designed specialy optimized and affordable monitoring stations costing as low as $200. Please check the GAIA air quality monitoring station product page.
  4. I want to add a new station on the map: Provided your monitoring station is qualified (for instance if it is using BAM, TOEM or GAIA technology), then adding a new station on the map is not only simple and straightforward but also completely free. Please refer to this page for the full explanation
  5. Data quality & real-time validation: The data published on World Air Quality Index is real-time and therefore unvalidated at the time of publication. In order to strengthen the quality, a set of real-time AI algorithms are used to detect abnormal data conditions (sparks, low reporting, etc.) and automatically 'disable' data reported from defective stations.
  6. Historical data access: We are currently investigating with several international institutions (WHO, UN, GEO) the possibility to setup a framework for accessing the historical Air Quality data. If you are from an international institution, organization or university and want to join this effort, then check our data platform page.
  7. API (Application Programing interface): The World Air Quality Index project is offering a free API for maps, tiles and programatic JSON access. Check the API page for more information.
  8. Contributing to the World Air Quality Index project: The project is always looking for more hands to support the activities: For instance, to write articles, to improve our applications, to create new data visualization, to improve the air quality forecast or to translate the website and app to news languages. Check the contribute page for more info.
  9. Fundings: The World Air Quality Index project is independent from any governement and any "profit" corporation. It has so far not received any fundings from any public nor private entity. The limited income from online ads is used to cover infrastructure cost.
  10. Why chosing the U.S. EPA index to harmonize the data? This is mostly for historcal reason: When we started in 2007, there was not so many alternative, and the US EPA was actually quite proactive at promoting the idea of clean air, so the choice was natural. Some alternatives, such as the European “Common Air Quality Index” could also have been a good option, but the EEA failed to promote their standard. This won't be a problem for long anyways, since we are now working on a improvement which will allow users to select any scale they want among a list of more than 80 scales!
  11. How many cities do you currently provide air quality data for and is the info available on your app in each of them? We are providing the data for 9000 stations worldwide ~ that’s around 600 major cities in 70 countries. The info is available in the app for each of them, but not all of the cities have the “full” set of pollutant monitoring (e.g. PM2.5, PM10, Ozone, NO2, SO2, CO). For example, some only have PM10 or a composite AQI. We are also continuously increasing the coverage, targeting to get 10 to 20% more stations every year. The full list of cities and stations is available from this page.
  12. Media kit? Our public media kit is available from the media kit page.
Any other question, please check the Frequently Asked Question page.

made in 北京


대기질 순위

대기질 및 환경 오염 측정에 관하여 :

대기질 지수 단계에 대하여

AQI지수구분구간의미
0 - 50 좋음 대기오염 관련 질환자군에서도 영향이 유발되지 않을 수준
51 -100 보통 환자군에게 만성 노출시 경미한 영향이 유발될 수 있는 수준
101-150 민감군영향 환자군 및 민감군에게 유해한 영향이 유발될 수 있는 수준
151-200 나쁨 환자군 및 민감군(어린이, 노약자 등)에게 유해한 영향 유발, 일반인도 건강상 불쾌감을 경험할 수 있는 수준
201-300 매우나쁨 환자군 및 민감군에게 급성 노출시 심각한 영향 유발, 일반인도 약한 영향이 유발될 수 있는 수준
300+ 위험 환자군 및 민감군에게 응급 조치가 발생되거나, 일반인에게 유해한 영향이 유발될 수 있는 수준
(Reference: see airkorea.or.kr)

대기질과 오염에 대해 더 많은 것을 알아보려면 위키피디아의 대기질 문서(영어)을 보거나 대기질과 건강에 대한 AirNow 가이드(영어)를 참조해보세요.

매우 유용한 베이징의 의학박사 Richard Saint Cyr MD의 건강 관련 팁을 보려면 www.myhealthbeijing.com 의 블로그를 확인하세요.


사용안내: 모든 대기 질 데이터는 발행 당시에 검증되지 않았으며, 품질 보증으로 인해 이러한 데이터는 예고없이 언제든지 수정 될 수 있습니다. 세계 대기 품질 지수 프로젝트는이 정보의 내용을 편집함에있어 합당한 기술과 관심을 행사했으며 어떤 상황에서도 세계 대기 품질 지수 (World Air Quality Index) 프로젝트 팀 또는 그 대리인은이 데이터의 공급으로 인해 직접 또는 간접적으로 발생하는 손실, 상해 또는 손해에 대해 계약, 불법 행위 또는 기타의 책임을지지 않습니다.


설정


언어 설정 :


Temperature unit:
Celcius